Market Update July 2021
Why Do We Have a Housing Shortage?
by Sarah Perkins
Sales Executive
Lawyers Title of Arizona, Inc.
From 2000 to 2009 we over-built for the population. From 2010-2020 we under-built for the population. In 2004-2006, speculation building on credit caused huge problems. When the lending dried up, we had huge price declines. This is not a gap that can be closed easily.
True demand is based on population. With 290 people moving here a day, we have the population to support more building.
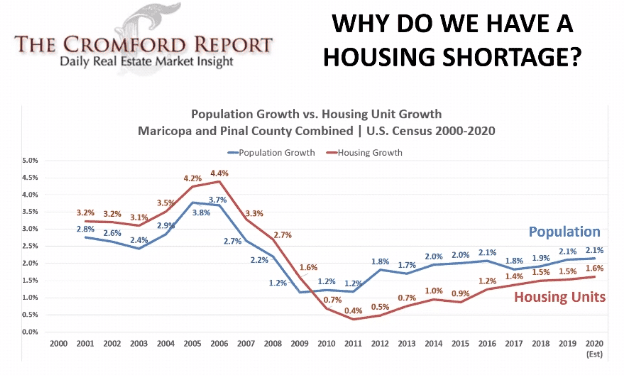
As housing units increase and reduce the gap between building and population growth the strong seller’s market will weaken and could even go flat. Check out the population growth versus housing unit growth. In 2008 we built 0.6 units for every added person but in 2012 it was 0.11 new units per person. In 2020 (through July) it was 0.30. 0.4 per person is ideal.

In 2000 there were 2.44 people per household, it then declined through 2009 and bottomed out at 2.32. Through July 2020 it reached 2.53 people per household. Arizona is #13 for having the most people per household in the country. How many houses are only for tourists? We do not know for sure. There is not a lot of available data on short term rentals. There are many properties that are short term rentals that are not registered as short term rentals.
The areas with the most new developments are also the areas with the most population growth. Queen Creek tops the charts at 16.2% population growth. Pinal County’s population growth outpaced Maricopa County’s.
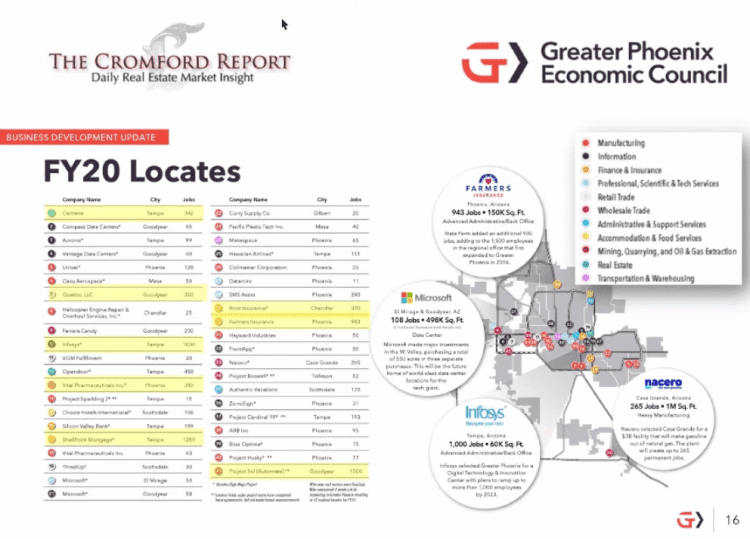
The Greater Phoenix Economic Council (GPEC) expects a 14% population increase by 2029. 11.2% of that growth in Phoenix, 13.8% on the east side, and 26.4% on the west side. This population growth is projected in conjunction with all of the job growth. GPEC has really focused on bringing in a lot of new jobs. In 2010 we were all real estate and tourism. Today our job market is much more diverse.
New Development:
- For interactive maps on land use and locations of new development, visit http://geo.azmag.gov/
maps/landuse/ - Single family permits are up 40% year to date. 25% fewer than in 2005 at this time.
- Builder associations are reporting real material shortages. 90% of builders are saying that something is behind and slowing them down. 95% are saying it is a slow down in appliances.
- Lumber prices are dropping but are not expected to reach pre-pandemic prices.
- Home renovations are starting to slow because people are going back to work.

Cromford Market Index (CMI):
Available on the main page of the Cromford Report: https://

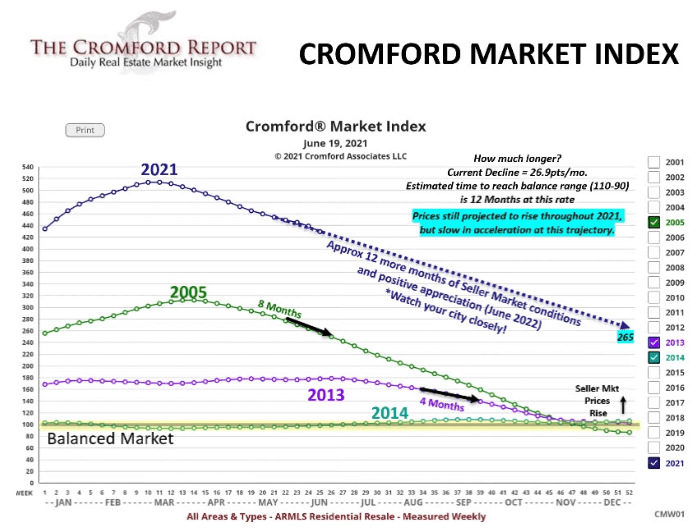
- 100 is balanced and prices rise at the rate of inflation, below 100 is a buyer’s market, above 100 is a seller’s market, prices drop below 90, prices rise at 110. 2014 was a balanced market.
- On 3/20/2020 we were at 241
- On 5/15/2020 we were at 145.2
- Yesterday we were at 422.6
- We peaked on 3/14/2021 at 514.9
- Prior to this run, the previous peak was 312.9 in the spring of 2005.
- CMI is the predictor, it moves first and then appreciation follows. Cannot predict the CMI.
How long can we expect to be in this market? Some people think we are on the cusp of a market crash. While it is not a crash, the market is softening. Inventory is increasing more quickly than demand is declining. Demand has declined by 0.7 points in the past 30 days, while inventory has increased by 1.6 points. More options for buyers. It is not about the demand right now, it is about supply.
More listings are coming to market and staying active. The CMI is dropping because inventory is increasing. As inventory increases sellers are getting fewer offers and people are noticing.
How long will be in a seller’s market? Do not predict the CMI. It is not predictable. It is the predictor.
If we are dropping 27 points a month it will take a year to go to balance. By the end of December, we could be at 265, still a very strong seller’s market. This is a trendline, things can change quickly and each city has its own distinct market trendline.
As the seller’s market weakens, people will get very nervous about a market crash and declining property values and think may wait to buy. Remember demand needs to be lower than supply. With supply 75% below normal and demand nearly 7% above normal, it will take a long time for demand to be lower than supply. Before the 2008 crash, there were 57,000 active listings. Today there are fewer than 6,000 active listings. We do not have lots of listings. The housing market isn’t like bitcoin. We are not overbuilding without the population growth. Prices are not going to drop.
Using 4 week averages and tons of past data, we can draw a trendline from the CMI, illustrating when we might reach a balanced market. No reason to believe that this will stay in a basic trendline. It will adjust. It is only what we know today. Since each city is so different, it is best to check each one weekly. To show the variation between cities, these are the timelines in which they could reach balance:
- Phoenix 14.3 months
- Chandler 13 months
- Scottsdale 8 months
- Mesa 5.5 months
- Gilbert 4.8 months
Always look at demand. Today’s high CMI is mostly based on low supply. When demand drops below normal, there are fewer transactions, but prices still go up, just more slowly. Mortgage lenders loosened credit slightly in May. Demand increases when it is easier to get a loan. Low rates are still desirable.
For Sellers:
This means that as we come out of a strong seller’s market and into a weaker one they may have to pay seller concessions. In a strong seller’s market, only about 3% of sellers pay concessions. In a weak one, 25% of sellers pay concessions. They also have to make more repairs and the property will likely spend more time on the market. The market is still super hot and it is a great time to sell.
For Buyers:
It is still a great time to buy. Interest rates are low. Home prices will only continue increasing. Buyers last year who opted to wait are now paying 30% more for the same house. In Q1 2021 62.8% of homes sold were affordable. In 2005 26.6% of homes were affordable. Wages have increased 26% in the last 5 years. Rents are up 23%. To buy the median house with 10% down the monthly payment is $1843 a month. To rent the same house, renters are spending $1975 a month. It is cheaper to buy.

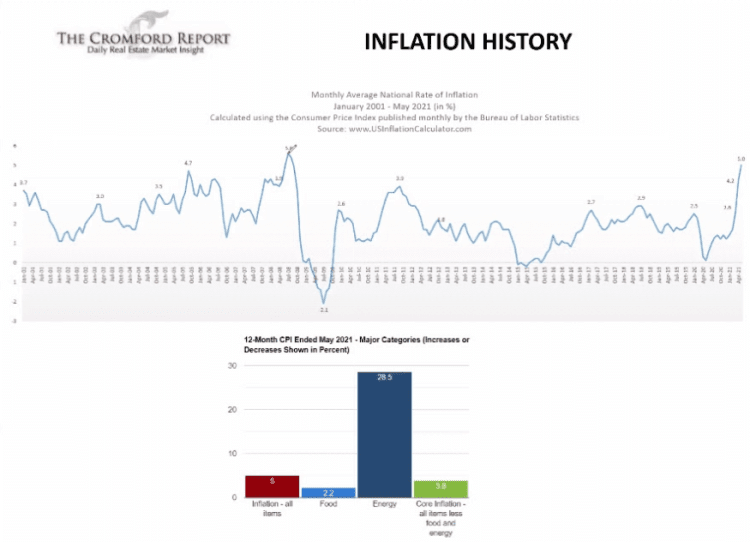
Inflation:
Hit 5%. People are talking about housing prices dropping due to inflation. Low inflation is not necessarily good. Low inflation happens when people are not spending their money. Inflation increases because people are spending a lot of money. We had a stimulus that drove more spending. The spikes in spending doesn’t always last. We were told to stay home and then they gave us money so we spent it on stuff like boats, guns, cars, clothes, appliances, etc. We were not making any new stuff to replace what we bought so we ran out and prices went up. Supply and demand.

Inflation is the relationship of appreciation. The rate of inflation is the appreciation in a balanced market. The buyer’s market appreciates a lower rate than the rate of inflation. Seller’s markets appreciate at a rate higher than the rate of inflation.

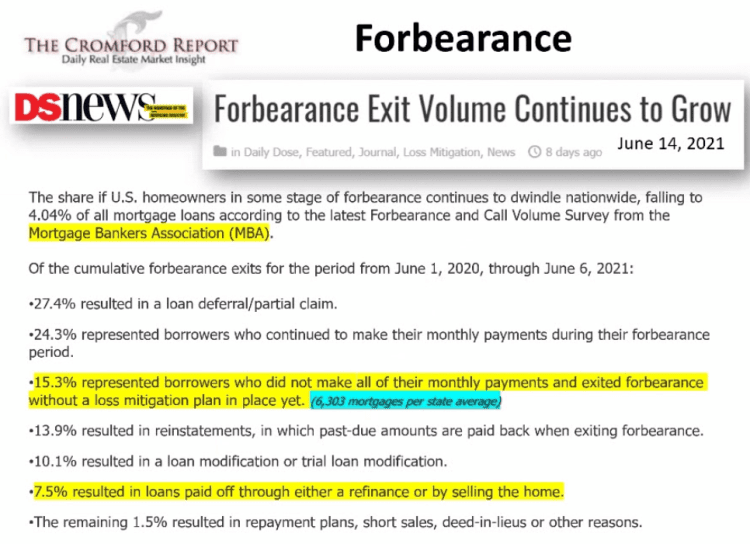
Forbearance:
Forbearance could speed up the rate at which we move to balance. There are about 2 million mortgages in forbearance. What will happen in July? Struggling borrowers have until June 30 to enter into a forbearance plan and will have the ability to stay for 12 months. Forbearance exits will be spread out across the next 12 months. Most homeowners are staying in their homes after exiting their plan. About 15% of borrowers are leaving forbearance without a loss mitigation plan in place. Divided up by state, we could have about 6,300 borrowers that need to sell.
Supply:
Supply is up 28% since February but is still 40% below this time last year. If we got 6,300 new listings we would match where we were in 2018.

Certain price ranges have bigger increases than others:
- $300K-$400K is up 31.4% since February.
- $400K-$800K is up 79.5% since February.
- $800K-$1M is up 67.6% since February.
- Over $1M is up 10.1% since February.
More and more homeowners are comfortable with selling their home now. We are seeing the high side of seasonality and going into the summer slowdown, which is normal. We are following the 2019 trends, which is a good thing. A more balanced market is a healthier market.
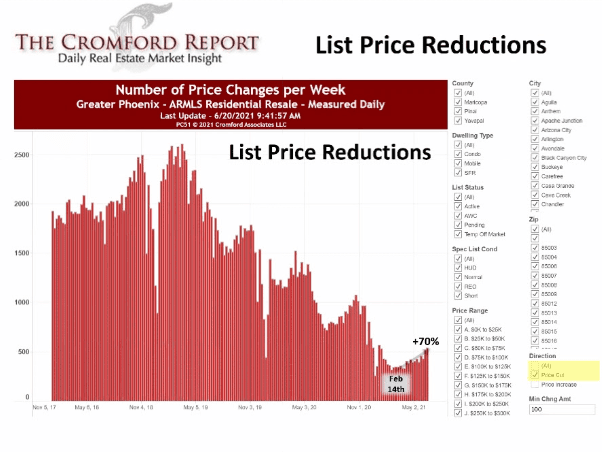
Price Reductions:
Price reductions have increased by 70% from 2/14/21. We are seeing a lot of price reductions but not a lot compared to other years. This is a trend.
Demand:
Listings under contract are down 16.9% from this time in 2020 and down only 5% from this time in 2019. Again, here price point matters:
- $300K-$400K listings under contract are down 3.6% below 2020.
- $400K-$800K listings under contract are up 24.3% above 2020.
- $800K-$1M listings under contract are up 42.2% above 2020.
- $1M+ listings under contract are up 56.4% above 2020.
So far in June, 61.5% of listings sold over asking, reflecting contracts written 30-45 days ago, the market was different 30-45 days ago. June closings are closing 2% higher than their list prices. 97% is the normal range for closing. June is 102%. The median amount over asking is $20,000.
The median days on market is still only 6 days, the same as February. This number will start to go up due to the increased inventory.
2021 is now the new benchmark with the biggest sales count ever from January through May. There have been 1.1% more sales than in 2005.
Luxury had the biggest year ever in 2020 and so far in 2021 it is continuing. The first 5 months of 2021 saw an increase of 147% in closings for properties over $1M.
Final Thoughts:
The seller’s market is weakening but we do not have desperate sellers so we are not in a buyer’s market. Inventory is rising and demand remains solid. May had an appreciation rate of 39% and June, so far, is at 38% appreciation. The appreciation rates will slow as more inventory comes to market and slowing appreciation is a good thing. There is lots of job growth with more to come.